
Angular DevTools
Angular DevTools extends Chrome DevTools adding Angular specific debugging and profiling capabilities. You can use Angular DevTools to understand the structure of your application and preview the state of the directive and the component instances. To get insights into the execution of the application, you can use the profiler tab, which shows you the individual change detection cycles, what triggered them, and how much time Angular spent in them.
About Angular DevTools
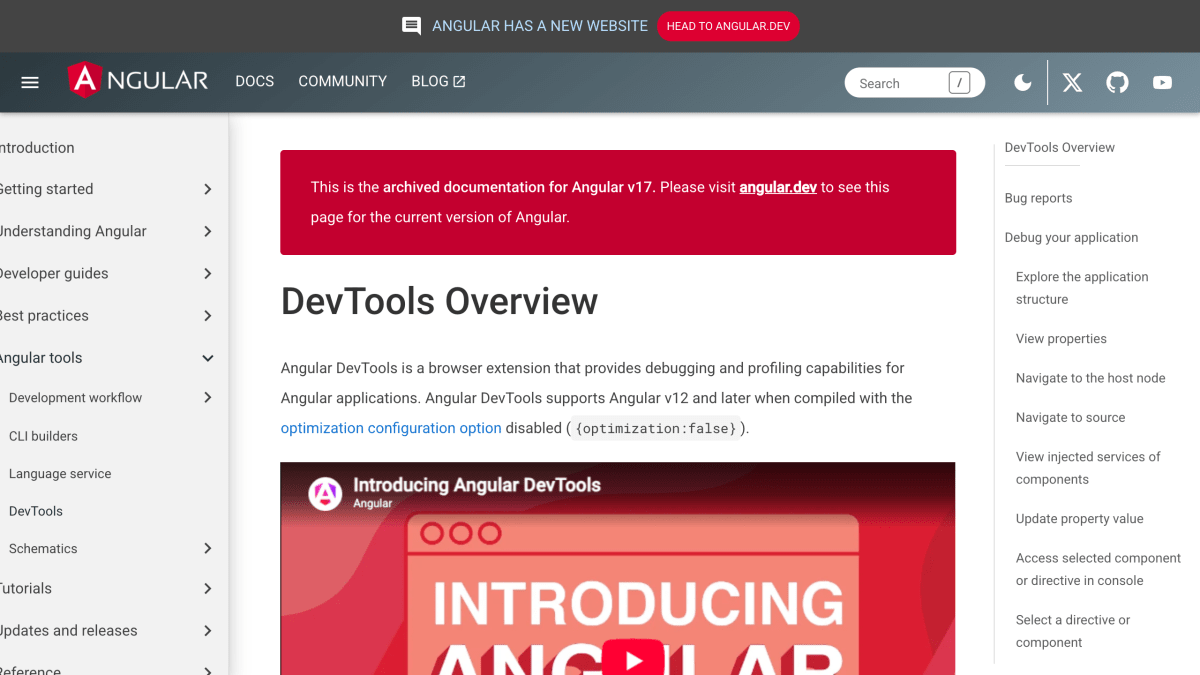
Angular DevTools is a browser extension that adds debugging and profiling capabilities for Angular applications, available for Chrome and Firefox. It supports Angular v12 and later when the application is compiled with the optimization configuration option disabled. Once installed, it appears as an Angular tab within the browser's developer tools, offering two main panels: Components and Profiler.
The Components tab lets developers explore the hierarchical structure of components and directives in an application, inspect and edit their properties and state, view injected services and their resolution paths, navigate to a component's source definition or its associated DOM node, and select elements directly from the page. It also provides console shortcuts ($ng0, $ng1) to access recently selected component or directive instances, along with keyboard navigation and search within the component tree.
The Profiler tab records and visualizes Angular's change detection execution, showing the duration of each change detection cycle, which components and directives were involved, and what triggered the cycle. It includes a flame graph view for inspecting execution at specific points in the render tree, a mode for highlighting components affected by OnPush change detection, and the ability to export and import profiling recordings as JSON files. Starting in Angular 17, the extension also includes an Injector Tree for exploring an application's injector hierarchy. It is intended for developers building and debugging Angular applications.
Key features
- Browser extension for Chrome and Firefox that debugs and profiles Angular applications
- Component tree explorer to inspect and edit component/directive state and properties
- Profiler with flame graph view to analyze change detection performance and frame drops
- Inspect element tool to select a component or directive directly from the page
- View injected services and their resolution path for a component
- Injector Tree view to explore the injector hierarchy (Angular v17+)
Frequently asked questions
What browsers does Angular DevTools support?
It is available as an extension in the Chrome Web Store and in Firefox Addons.
What versions of Angular does it work with?
It supports Angular v12 and later when the app is compiled with the optimization configuration option disabled ({optimization:false}).
What can I do in the Components tab?
You can explore the component and directive tree, preview or edit instance state and properties, and navigate to the host DOM node or source definition.
What does the Profiler tab show?
It records change detection execution and displays it as a bar timeline or flame graph, showing time spent per component and estimated frame drops.
How do I report bugs or issues?
Issues and feature requests are reported on GitHub, and Profiler bug reports should include an exported profile recording via the Save Profile button.


SerpApi - Search API
SerpApi's Search API makes it easy and fast to scrape Google and other search engines.

Show your product to thousands of developers
· 100k monthly pageviews
· 7k newsletter subscribers
You might also like
Blisk
Browser/ProgrammingDownload Blisk - a browser for web developers. Blisk - is a developer oriented browser with devices, URL and scroll sync, auto-refresh, screenshots and screen recorder.
Brave
BrowserThe Brave browser is a fast, private and secure web browser for PC, Mac and mobile. Download now to enjoy a faster ad-free browsing experience that saves data and battery life by blocking tracking software.
Browserling
Browser/TestingTry for free now! Cross browser test your website immediately in all web browsers - Internet Explorer, Edge, Chrome, Safari, Firefox, and Opera.
BrowserStack
Browser/TestingInstant access to 2000+ browsers and real iOS and Android devices for cross browser testing. Ship apps and websites that work for everyone, every time. Get Free Trial.
Causeway
Browser/Tooling/AIGive your AI a real Chromium browser: Causeway exposes 52 MCP tools to navigate, read, click, type, screenshot, and run JavaScript through CDP.
Check My Links
Browser/ExtensionCheck My Links is a link checker that crawls through your webpage and looks for broken links.