

Data Viz Color Picker
A color palette generator for data visualizations.
About Data Viz Color Picker
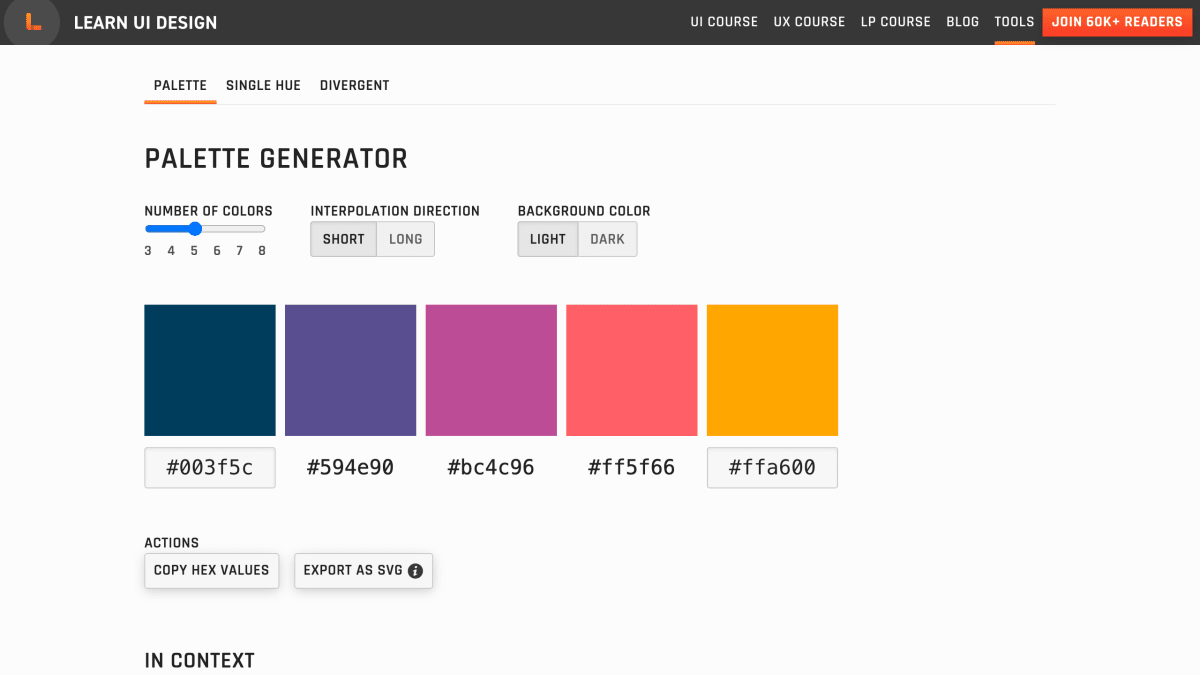
The Data Viz Color Picker is a browser-based tool for generating color palettes for charts, dashboards, and data visualizations. It offers three palette modes: a palette generator that creates visually equidistant colors for categorical data like pie charts and grouped bar charts, a single-hue scale for representing the strength of one variable through color intensity, and a divergent scale for showing transitions between two extremes through a neutral midpoint, such as maps or calendar heatmaps.
Users can customize the number of colors, interpolation direction, background color, brightness, and color intensity, and can specify custom endpoint colors including brand colors. Output can be copied as HEX values or exported as SVG, with an "in context" preview showing how the palette looks applied to sample visualizations like maps and calendars.
The tool is built by Kennedy Design, Inc., the company behind the Learn UI Design course, and is offered alongside other free design tools including a gradient generator, mesh gradient generator, accessible color generator, and an interactive typography tutorial.
Key features
- Generates visually equidistant color palettes for charts, maps, and dashboards
- Palette mode lets you set both endpoint colors, including a brand color
- Single Hue Scale generator for showing the value of one variable
- Divergent Color Scale generator for transitions from one extreme through a neutral midpoint to another extreme
- Export palettes as SVG or copy HEX values
- Preview palettes in context (e.g. maps, calendars) with light or dark backgrounds
Frequently asked questions
Is this tool free to use?
Yes, it is offered as a free tool alongside the site's other free design tools like the Gradient Generator and Accessible Color Generator.
What formats can I export the palette in?
You can copy HEX values or export the palette as SVG.
Who is this tool for?
It's for designers and developers creating data visualizations like pie charts, grouped bar charts, and maps who need visually distinguishable color palettes.
What types of color scales does it support?
It supports a palette generator for equidistant colors, a single hue scale for showing one variable's value, and a divergent scale for transitions between two extremes through a neutral midpoint.


SerpApi - Search API
SerpApi's Search API makes it easy and fast to scrape Google and other search engines.

Show your product to thousands of developers
· 100k monthly pageviews
· 7k newsletter subscribers
You might also like
Contrast Ratio
Accessibility/ColorEasily calculate color contrast ratios.
Coolors
ColorGenerate or browse beautiful color combinations for your designs.
CSS Gradient
Code Challenge/Color/ProgrammingAs a free css gradient generator tool, this website lets you create a colorful gradient background for your website, blog, or social media profile.
Eggradients
ColorReady to use gradient background colors. Cool Gradients are prepared according to the latest design trends. And it is served in the form of eggs. With hex and CSS codes.
Gradient
ColorThousands of trendy color gradients in a curated collection that is updated daily. Get a fresh color gradient for your next design project and save all the gradients you like.
Gradient Generator
ColorCreate brilliant gradients in 8 color spaces. 1-click export to CSS & SVG.