


D3.js
D3 is a JavaScript library for visualizing data with HTML, SVG, and CSS.
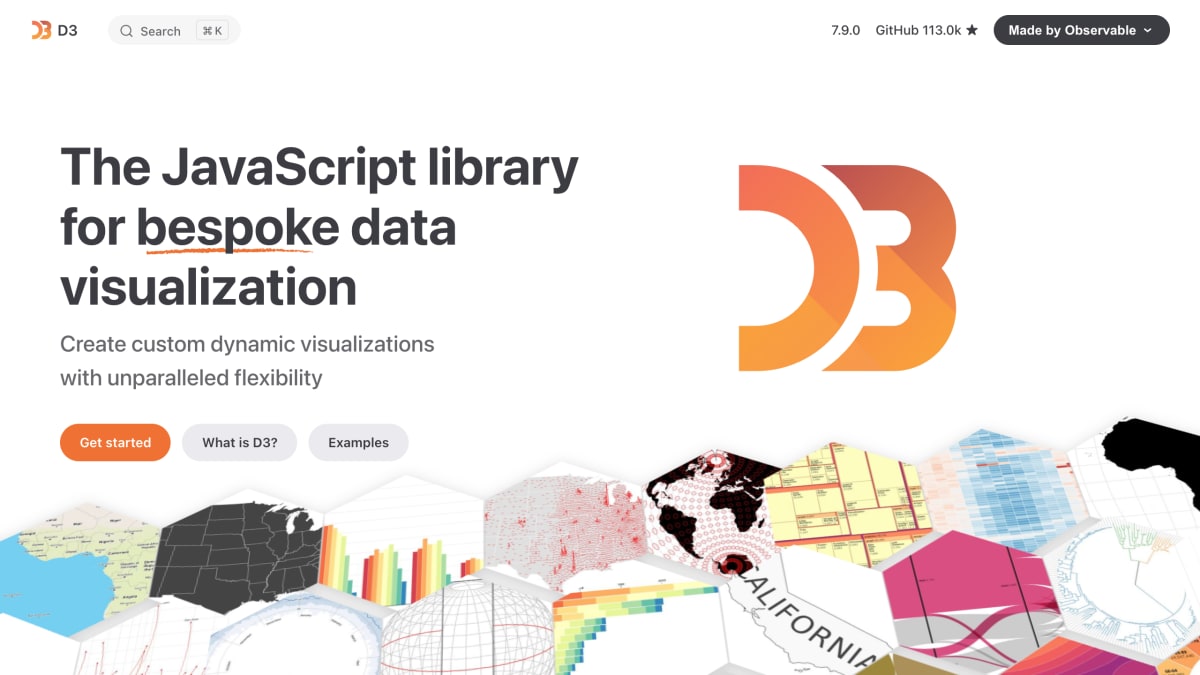
About D3.js
D3.js is a JavaScript library for building custom, dynamic data visualizations in the browser. It provides tools for binding data to the DOM through selections and transitions, encoding data into visual attributes via scales and axes, and rendering shapes such as arcs, lines, curves, and pie charts. It also includes layout algorithms for treemaps, trees, force-directed graphs, Voronoi diagrams, circle-packing, and chord diagrams, along with support for geographic map projections, CSV parsing, date parsing and formatting, color spaces, and statistical functions.
The library supports interactive behaviors including panning, zooming, brushing, and dragging, enabling exploratory data visualization interfaces. It is developed and maintained by Observable, which also builds Observable Plot, a higher-level charting API built on top of D3, and offers a data workflow platform for connecting to live data sources and collaborating on analysis.
D3.js is intended for developers building custom, code-based data visualizations rather than using pre-configured chart templates. It is distributed under the ISC License.
Key features
- Data-driven DOM selections, updates, and transitions without a virtual DOM
- Scales and axes for encoding data into position, size, and color
- Built-in shape generators for arcs, lines, areas, pies, and stacks
- Reusable interaction behaviors including panning, zooming, brushing, and dragging
- Layout algorithms for treemaps, trees, force-directed graphs, and Voronoi diagrams
- Geographic map projections with adaptive sampling and flexible clipping
Frequently asked questions
Is D3.js free to use?
Yes, D3 is released under the ISC License, a permissive open-source license.
What language is D3 written in?
D3 is a JavaScript library for creating data visualizations.
Who maintains D3?
D3 is developed by Observable, the platform for collaborative data analysis.
Is there a higher-level charting option built on D3?
Yes, the D3 team also builds Observable Plot, a high-level API for quick charts built on top of D3.
Where can I get help or discuss D3?
D3 has a Forum, a Slack community, and GitHub Discussions for support and discussion.


SerpApi - Search API
SerpApi's Search API makes it easy and fast to scrape Google and other search engines.

Show your product to thousands of developers
· 100k monthly pageviews
· 7k newsletter subscribers
You might also like
Clerk
Authentication/Library/ProgrammingDrop-in React components for authentication and authorization.
Corbado
Authentication/Library/ProgrammingPasskey-first authentication for developers.
Cytoscape.js
Library/ProgrammingGraph theory / network library for analysis and visualisation - compatible with CommonJS/Node.js/Browserify/Webpack, AMD/Require.js, npm, Bower, jspm, Meteor/Atmosphere, jQuery, and plain JS/JavaScript.
daisyUI
Library/Programming/UITailwind CSS Components plugin — daisyUI tailwind component library.
Flowbite
Icon/Library/UIGet started with an open-source library of over 600+ UI components, sections, and pages built with the utility classes from Tailwind CSS and designed in Figma.
Grommet
Library/ProgrammingGrommet documentation.