

Briks
The AI Spreadsheet to Create Reports, Presentations, Charts, and Visuals.
About Briks
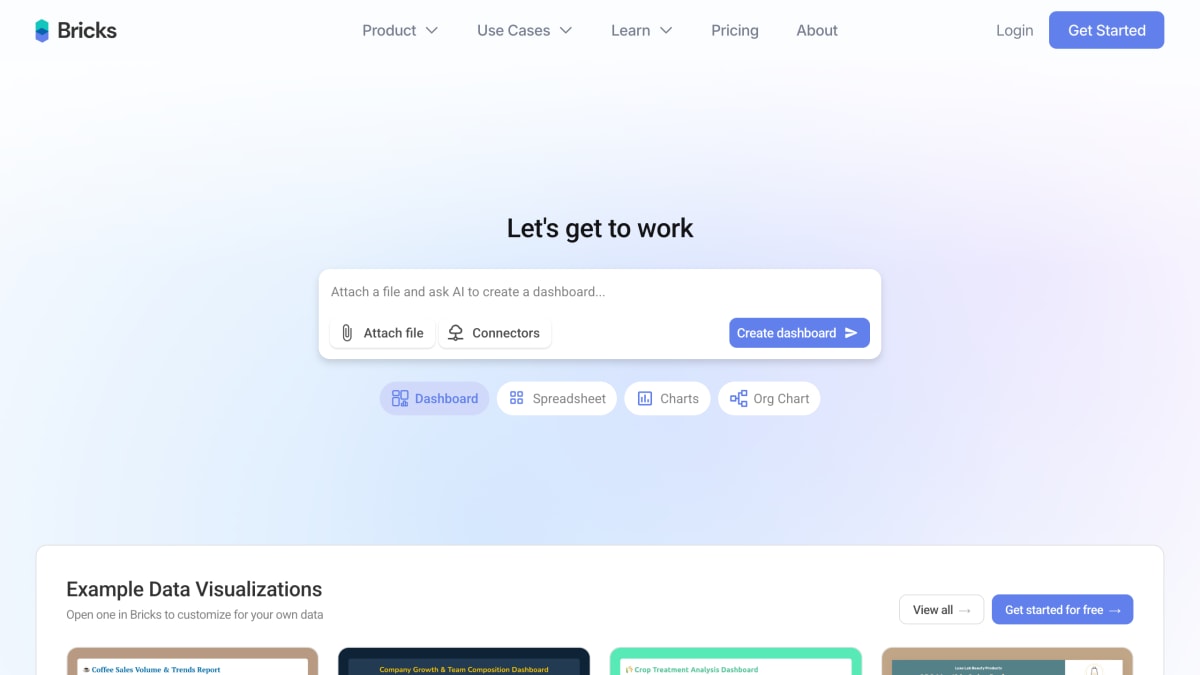
Bricks is an AI-powered platform that converts data from CSV, Excel, Google Sheets, or databases into dashboards, reports, charts, presentations, and org charts. Users upload or connect data and the tool generates visualizations that can be edited manually through drag-and-drop controls or through natural-language AI commands.
The platform supports interactive filtering by clicking data points, one-click refresh to regenerate charts when underlying data changes while preserving layout, and reusable templates that apply a saved dashboard layout to new data. It also offers pre-built visual themes and chart types including geo maps, heatmaps, treemaps, sankey diagrams, funnels, combo charts, scatter plots, and donut charts.
Bricks is aimed at business users and teams across functions such as sales, marketing, HR, finance, customer support, operations, and IT, as well as organizations in sectors including financial services, education, healthcare, government, retail, manufacturing, real estate, technology, and construction. It is positioned for individuals and organizations of varying sizes, from startups to enterprises, who need dashboard and reporting capabilities without dedicated data teams, IT support, or the complexity of tools like Tableau or Power BI.
Key features
- AI-generated dashboards from CSV and Excel files
- AI-generated reports, slide decks, and org charts from data
- One-click dashboard refresh that regenerates charts while preserving layout
- Interactive filtering by clicking data points
- Reusable dashboard templates for repeated use with fresh data
- Data import from Google Sheets or databases
Frequently asked questions
What can Bricks create from my data?
Bricks can generate dashboards, reports, charts and graphs, spreadsheets, presentations, and org charts from uploaded data like CSV and Excel files.
Where can I import data from?
You can bring data in from Google Sheets or databases, in addition to uploading CSV and Excel files.
Who is Bricks for?
Bricks is used across industries like financial services, education, healthcare, government, retail, and by teams such as sales, marketing, HR, and IT, from startups to enterprises.
How does Bricks compare to tools like Excel, Canva, or Tableau?
Bricks positions itself as easier than Excel's manual chart building, more data-capable than Canva, and simpler than the complexity of Tableau or Power BI.
Can I customize dashboards after they're generated?
Yes, dashboards can be manually dragged and dropped or edited using natural language AI commands, with professional themes applied without design work.


SerpApi - Search API
SerpApi's Search API makes it easy and fast to scrape Google and other search engines.

Show your product to thousands of developers
· 100k monthly pageviews
· 7k newsletter subscribers
You might also like
Best AI Agents Directory
Productivity/AI/StartupCurated Collection of the Best AI Agents to Boost Your Workflow.
Blurbackground AI
AI/Image/DesignBlurbackground.AI is a free online tool to edit background swiftly.
Botpool
Freelance/AI/JobMarketplace for AI-Powered Freelancers.
Catalog by Thesys
Database/AICatalog by Thesys is a curated collection of AI agents designed to help you find the right agent for your needs. Whether you're exploring AI for automation, decision-making, or creative tasks, it simplifies your search with the categorization and listing of all the AI agents.
CatchDoms
Domain/SEO/AIExpired and auction domain finder aggregating 100k+ domains from 17 marketplaces, enriched with SEO metrics (Trust Flow, backlinks, age, historical tech stack). Ships a public REST API and an open-source MCP server so AI assistants like Claude can query the catalog in natural language.
Causeway
Browser/Tooling/AIGive your AI a real Chromium browser: Causeway exposes 52 MCP tools to navigate, read, click, type, screenshot, and run JavaScript through CDP.