

dygraphs
Dygraphs is a fast, flexible open source JavaScript charting library. It allows users to explore and interpret dense data sets.
About dygraphs
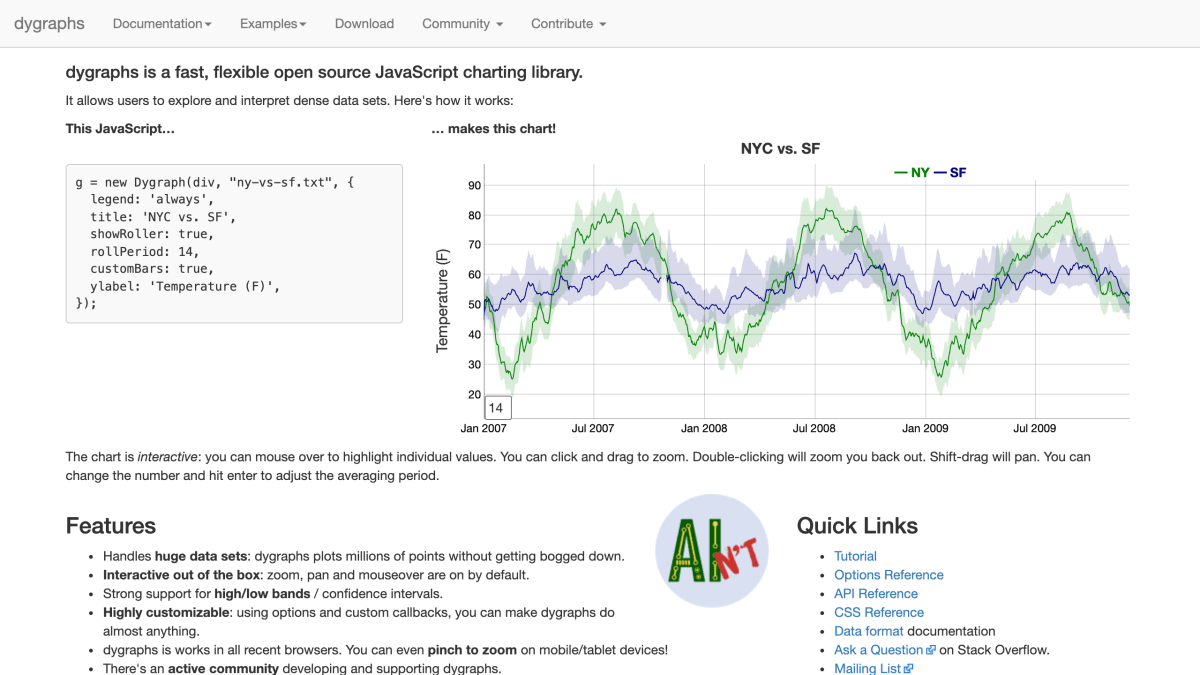
dygraphs is an open source JavaScript charting library for plotting and exploring dense data sets in the browser. Charts are created by instantiating a Dygraph object with a container element, a data source, and an options object, and are interactive by default: mouseover highlights individual values, click-and-drag zooms, double-click resets the zoom, and shift-drag pans. Options include a legend, title, axis labels, and a data roller with an adjustable averaging period.
The library is designed to handle large data sets, plotting millions of points, and includes strong support for high/low bands and confidence intervals. Behavior and appearance can be customized extensively through options and custom callbacks. It works across recent desktop browsers and supports pinch-to-zoom on mobile and tablet devices.
It is intended for developers building interactive charts for the web. It can be installed via npm and used with bundlers such as webpack, browserify, or rollup, importing the Dygraph object from the package. Documentation available includes a tutorial, an options reference, an API reference, a CSS reference, and a data format reference.
Key features
- Plots millions of data points without performance degradation
- Interactive zoom, pan, and mouseover enabled by default
- Strong support for high/low bands and confidence intervals
- Highly customizable via options and custom callbacks
- Works in all recent browsers with pinch-to-zoom support on mobile/tablet
Frequently asked questions
Is dygraphs free to use?
Yes, dygraphs is a free, open source JavaScript charting library.
What platforms or languages does dygraphs support?
dygraphs is a JavaScript library that works in all recent browsers, including pinch-to-zoom support on mobile and tablet devices.
Can I install dygraphs via npm?
Yes, it can be installed with npm install --save dygraphs and used with bundlers like webpack, browserify, or rollup.
Who is dygraphs for?
It is for developers who need to explore and interpret dense data sets through interactive charts.
Where can I get help or support?
Support is available through Stack Overflow, a mailing list, and an active community, with source code hosted on GitHub.


SerpApi - Search API
SerpApi's Search API makes it easy and fast to scrape Google and other search engines.

Show your product to thousands of developers
· 100k monthly pageviews
· 7k newsletter subscribers
You might also like
Divize
Code Challenge/Learn/ProgrammingLearn, Write, Master: HTML/CSS Through Real UI Challenges.
Divjoy
Programming/TemplateThe React codebase generator. Divjoy handles all the integration details. From routing to React hooks, you'll have everything you need to build something great.
DOM Events
Learn/ProgrammingLearn how the DOM Event system works through exploration.
Dymo
Security/ProgrammingData intelligence and protection, your security solution and Big Data for user recognition.
Eloquent JavaScript
Book/ProgrammingThis is a book about JavaScript, programming, and the wonders of the digital.
Epic React
Learn/ProgrammingStrap in and take your React applications to the next level.