

CanvasJs
HTML5 JavaScript Charts built on top of HTML5 Canvas Element. Renders across devices & is 10x faster than JavaScript Charting libraries based on SVG.
About CanvasJs
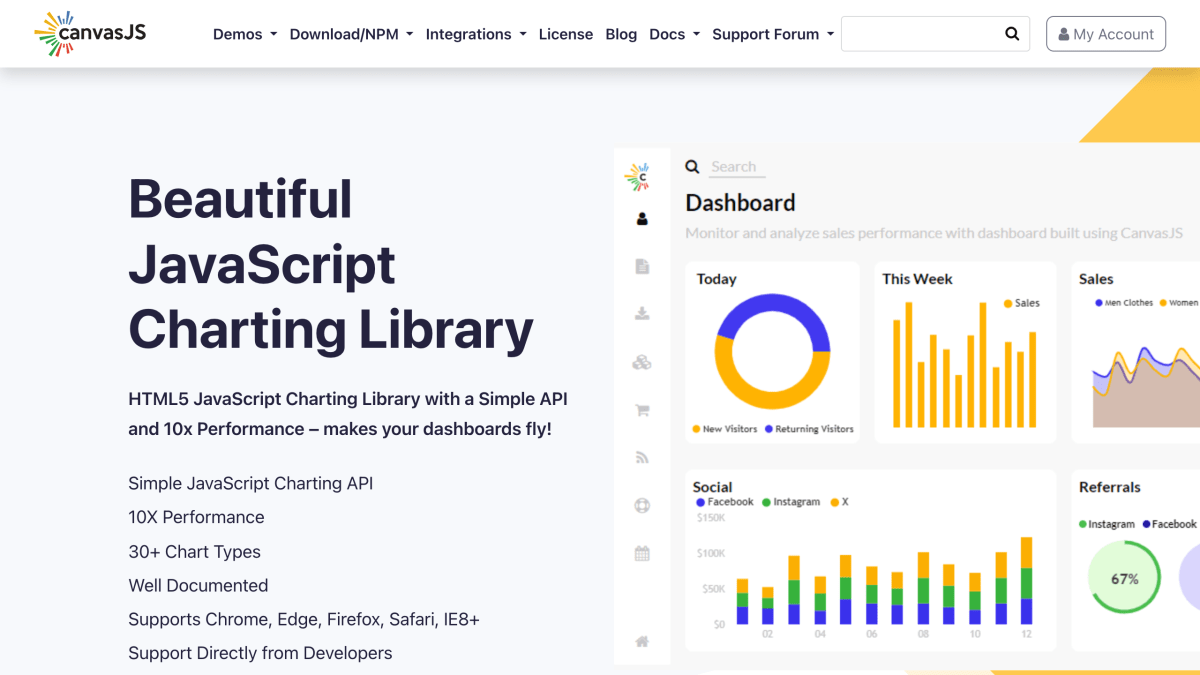
CanvasJS is an HTML5 JavaScript charting library used to build charts and dashboards for web applications. It provides over 30 chart types, including line, column, bar, spline, area, pie, doughnut, waterfall, funnel, pyramid, candlestick, OHLC, scatter, bubble, box and whisker, error, and Pareto charts, along with a StockChart module for financial data visualization. It supports Chrome, Edge, Firefox, Safari, and IE8+, and renders across devices including phones, tablets, and desktops.
The library integrates with front-end frameworks such as React, Angular, Vue.js, and jQuery, as well as server-side technologies including PHP, Python, ASP.NET MVC, Spring MVC, and JSP. It is installable via NPM or direct download, and includes multiple built-in themes, zooming and panning, multiple and logarithmic axes, and dynamic chart updates.
The product is aimed at developers building data visualization dashboards, with an emphasis on rendering performance for large datasets. It is developed by Fenopix, Inc. and offers documentation, a chart gallery, and a support forum staffed directly by the developers.
Key features
- Renders 30+ chart types including line, column, bar, pie, and candlestick charts
- Handles 100,000 data points in a few hundred milliseconds
- Includes StockCharts for financial/stock data visualization
- Supports zooming, panning, multiple axes, and logarithmic axes
- Works across React, Angular, jQuery, PHP, ASP.NET MVC, Spring MVC, and JSP
- Renders on Chrome, Edge, Firefox, Safari, and IE8+ across desktop and mobile devices
Frequently asked questions
What frameworks and platforms does CanvasJS integrate with?
It integrates with front-end frameworks like React, Angular, jQuery, and Vue.js, and server-side technologies like PHP, Python, ASP.NET MVC, Spring MVC, and JSP.
How is CanvasJS installed?
It can be installed via direct download or NPM.
How many chart types does it support?
It supports over 30 chart types, including line, spline, area, column, bar, pie, doughnut, waterfall, candlestick, and OHLC charts.
What browsers and devices does it support?
It supports Chrome, Edge, Firefox, Safari, and IE8+, and renders across devices including iPhone, iPad, Android, Mac, and PCs.
How performant is CanvasJS with large datasets?
It can render 100,000 data points in just a few hundred milliseconds.


SerpApi - Search API
SerpApi's Search API makes it easy and fast to scrape Google and other search engines.

Show your product to thousands of developers
· 100k monthly pageviews
· 7k newsletter subscribers
You might also like
ally.js
Accessibility/LibraryJavaScript library to help modern web applications with accessibility concerns by making accessibility simpler.
Chakra
Library/Programming/UISimple, Modular and Accessible UI Components for your React Applications.
Chargeblast
Analytics/LibraryChargeblast helps developers simplify their payment stack and not worry about blocking disputes.
Chart.js
Library/ProgrammingSimple, clean and engaging HTML5 based JavaScript charts. Chart.js is an easy way to include animated, interactive graphs on your website for free.
Chartist
Library/ProgrammingCreate responsive, scalable and good looking charts with chartist.js.
Choc UI
Library/Programming/UIChoc UI is a set of accessible and reusable components that are commonly used in web applications.